Article Text

Abstract
Background Acute pollutant-related lung function changes among children varies across pollutants and lag periods. We examined whether short-term air pollutant fluctuations were related to daily lung function among a panel of children and whether these effects are modified by airway hyperresponsiveness, location and asthma severity.
Methods Students from randomly selected grade 4 classrooms at seven primary schools in Durban, participated, together with asthmatic children from grades 3–6 (n=423). The schools were from high pollutant exposed communities (south) and compared with schools from communities with lower levels of pollution (north), with similar socioeconomic profiles. Interviews, spirometry and methacholine challenge testing were conducted. Bihourly lung function measurements were performed over a 3-week period in four phases. During all schooldays, students blew into their personal digital monitors every 1.5–2 hours. Nitrogen dioxide (NO2), nitrogen oxide (NO), sulphur dioxide and particulate matter (<10 μm diameter) (PM10) were measured at each school. Generalised estimating equations assessed lag effects, using single-pollutant (single or distributed lags) models.
Results FEV1 declines ranged from 13 to 18 mL per unit increase in IQR for NO and 14–23 mL for NO2. Among the 5-day average models, a 20 mL and 30 mL greater drop in FEV1 per IQR for NO2 and NO, respectively, among those with airway hyperresponsiveness compared with those without. Effects were seen among those with normal airways.
Conclusions This first panel study in sub-Saharan Africa, showed significant declines in lung function, in response to NO and NO2 with effects modified by airway hyperresponsiveness or persistent asthma.
- paediatric asthma
- asthma epidemiology
Statistics from Altmetric.com
Key messages
What is the key question?
Does exposure to ambient pollutants result in acute changes in lung function among asthmatic and non-asthmatic schoolchildren, and is this modified by airway hyperresponsiveness?
What is the bottom line?
Short-term fluctuations in oxides of nitrogen are associated with lung function changes in a dose–response manner, and these effects are modified by airway responsiveness, asthma status and location.
Why read on?
This is the first sub-Saharan study of a panel of schoolchildren, selected from communities with relatively high levels of pollution and compared with children without such exposures, which not only provides evidence of pollutant-related changes in acute lung function, but that these effects are modified by important factors and are present in those without persistent asthma.
Introduction
Evidence for the association of ambient air pollutants with adverse respiratory health among children is convincing1 and includes linkages between asthma incidence and prevalence, emergency room visits and school absences with exposure to particulate matter (PM), ozone (O3), oxides of nitrogen (NOx) and sulphur dioxide (SO2).2 3 These findings are particularly evident among vulnerable subpopulations, including asthmatic children, but the effects are less emphatic among children without asthma. While panel studies of asthmatic children have associated acute symptoms with fluctuations in air pollution levels, more objective tests of airway function, particularly within samples that include both asthmatic and non-asthmatic children, have yielded variable results.4 5
Panel studies offer advantages over cross-sectional studies through the repeated measures design, allowing participants to serve as their own controls. In addition, panel studies with repeated measures over short timeframes provide an opportunity of investigating lagged effects of exposure. Lung function measures may be a more sensitive indicator of pollutant-related impacts on respiratory health, than reported symptoms, medication usage or emergency department visits.6–8
Asthmatic children are the population of choice in panel studies, as a vulnerable subpopulation within whom effects are most pronounced, sometimes at levels below international standards.9 The review by Li et al identified the wide range of findings for declines in peak expiratory flow (PEF) across the different studies for the various pollutants and across different lags of exposure.4 In a meta-analysis of 22 studies, effects varied across particle size, ranging from −12 mL/min per µg/m3 increase in PM10 to −63 mL/min per µg/m3 increase in PM2.5.10 In a 2010 meta-analysis of 34 panel studies, a 10 µg/m3 increase in PM10 was associated with a 82 mL/min decrease of PEF.5 Findings for NO2 vary: the earlier meta-analysis showed 180 mL/min decline in PEF per µg/m3 increase in NO2, while the subsequent report found no NO2 related effect. Other panel studies have reported effects with NO2 of 28 mL/min in PEF for a 10 µg/m3 increase in pollutant.11 Responses to SO2 varied across studies and generally estimates with wide CIs, including the null effect.4 7 9 10
Studies using population-based samples that include asthmatics and non-asthmatics fail to exhibit strong exposure–response relationships.1 9 Population-based studies typically define asthma cases using reported physician diagnoses.10 Comparison of effects between those with and without disease in studies without objective measures may be biased, particularly within populations in which healthcare access is restricted. There have been limited studies which have employed tests of airway hyperresponsiveness (AHR). The latter provides a more sensitive marker of airway compromise and therefore likely to explain more precisely exposure–outcome relationships.
This paper examines whether short-term fluctuations in air pollutant concentrations are related to changes in daily lung function parameters among a panel of 423 children in Durban, South Africa, and whether these effects are modified by AHR, location and asthmatic status.
Methods
Background of study area
Durban is Africa’s busiest port and the primary route for imported crude oil and exported refined petroleum and petrochemical products. The south of the city is highly industrialised with elevated levels of SO2, NOx, PM, carbon monoxide (CO), hydrogen sulphide (H2S) and other pollutants.12
Selection of communities and schools
Four communities in the industrialised south and three communities in north Durban were selected on the basis of contrasts in emission sources and expected pollutant levels, but with similar socioeconomic profiles. The south communities are located in residential areas in close proximity to industrial emissions, while this is not the case for the north communities. In our sample, approximately 20% of participants had incomes below the ‘upper-bound poverty line’ of US$76 per person per month13 A primary school in each of the seven communities was selected (figure 1) based on their proximity to sources of pollutant exposure, geographical location and numbers of children bussed in from outside communities. Only schools where bussing of students from surrounding communities was minimal (<15%) were eligible to ensure that exposure measurements at the schools were reasonably representative of residential exposures of the study sample. One school was randomly chosen from each community. None was selected on the basis of the health status of children at the school.14

Map of the city of Durban, showing the location of the participating schools, additional monitoring sites and selected point sources (modified from Mentz et al 20).
Student recruitment
In each school, one or two fourth grade classes were randomly selected. To ensure statistical power to investigate the relationship between persistent asthma and exposure, additional pupils with known or probable persistent asthma were identified from grades 3–6 using a previously validated screening instrument.15 ‘Known asthma’ was based on the report of having been diagnosed as such by a doctor, while ‘probable persistent asthma’ was based on positive responses to daytime symptoms of persistent wheezing, persistent coughing, chest tightness or shortness of breath more than two times per week (during and outside exercise), sleep disturbances due to wheezing, coughing, chest tightness or shortness of breath more than twice per month or daily use of doctor prescribed medication (National Asthma Education and Prevention Program (NAEPP)16 and online supplementary material 1). A total of 423 students participated in the study. Of the 366 children from the randomly selected classrooms, 342 (93.2%) participated, with 87.1% (n=81) of the known or probable persistent asthmatics participating. Written informed consent for the voluntary participation of the children was obtained from their parents or guardians.
Supplemental material
Student and caregiver interviews
Validated questionnaires14 15 were interviewer administered at school to the participating children, and at home to their caregivers, in their preferred language (English, Afrikaans and isiZulu, the latter two being local South African languages). The caregiver responses on child respiratory symptoms were used to determine moderate to severe persistent, mild persistent, mild intermittent or no asthma, using the approach described above in the screening process.16
Allergy status assessment
Skin-prick testing for allergic sensitisation was performed on each participant. Antigens tested included mixed cockroach, mixed dust mite, mould mix (Aspergillus, Cladosporium and Penicillium), cat, dog, mouse, rat and mixed grasses, plus histamine as a positive control and saline as a negative control. Atopy positivity was defined as a positive skin prick test to any of the eight common allergens tested.
Collection of pulmonary function data
The AirWatch (iMetrikus, Carlsbad, California, USA) monitor was used to monitor the fluctuations in PEF and FEV1. Children completed the AirWatch-based pulmonary testing over a 3-week period in each of four data collection phases, timed to best capture seasonal variation, within the constraints of school holidays and school activities (phase 1: 1–18 June; phase 2: 23 August–10 September; phase 3: 25 October–12 November and phase 4: 7–21 February) while in class, four times per day. These manoeuvres were done following intensive training and performed under supervision by the research team. The assessments were done simultaneously in all classrooms in all schools. Participants were retrained at the beginning of each of the four 3-week data collection phases. For each participant, a possible 240 lung function data points were available (four times per day, five schooldays per week, 3 weeks per cycle over four phases), with a total of 101 520.
Formal spirometry was conducted by experienced respiratory technicians according to American Thoracic Society (ATS) guidelines.17 For these technician-derived measurements, participants were advised to abstain from bronchodilators in the 24 hours preceding testing. Children with baseline obstructive patterns were repeat tested after bronchodilator administration. An abbreviated methacholine challenge testing (MCT) protocol was used for those without obstructive patterns.18 Results of the MCT were classified based on PC20 (dose of methacholine causing a 20% fall in baseline FEV1) as follows: marked AHR: PC20 ≤4 mg/mL; probable AHR: 4≤PC20≤8 mg/mL; possible AHR: 8<PC20≤16 mg/mL; none: PC20>16 mg/mL. The higher of the baseline values and the post-bronchodilator (if administered to that particular child either during standard spirometry and/or methacholine challenge testing) values were taken as the child’s ‘personal best’.
The technician-derived baseline spirometry measures were used to screen for spurious results from the in-class manoeuvres. Only those manoeuvres with FEV1 within 30–120% of that child's personal best were considered valid. The highest PEF and FEV1 from the valid manoeuvres from each session were analysed. Only the findings of the FEV1 are presented here.
Air quality monitoring
Air quality instrumentation deployed at each school provided continuous measurements of CO, SO2 NO2, NO and daily samples of PM10 during the four 3-week sessions of lung function monitoring. The Durban municipality also monitored various pollutants at additional sites, mostly in south Durban19 (figure 1). Multiple imputation (MI) was used to address pollutant data missingness. MI was performed for each pollutant and site independently. A Markov Chain Monte Carlo (MCMC) method with multiple chain option was used to permit the determination of hourly averages. A data set containing numerous possible predictor variables was constructed. It included meteorological variables, for example, barometric pressure, daily rain fall, relative humidity, temperature, vertical temperature difference (delta T), wind direction by sector (eight total) and wind speed, as well as pollutant variables at all available sites for the same type of pollutant being imputed, for example, SO2 was imputed using observations at the seven school sites as well as observations at eight other sites. The predictor variable data set was augmented by defining leading and lagging variables (±1 day). After optimising and evaluating performance, m=5 daily average values were generated for each pollutant and site for use in the health model.20
Most of usable exposure (PM10, SO2, NO, NO2) had an overall capture rate for valid 24 hours observations between 80% and 83,4% of the study period, and missing data were largely attributable to holidays, equipment failures, etc. Although missing data was not larger than 25%, the clustering pattern of the missing data was high, with some sites having less than 70% of captured data. Thus MI was deemed appropriate.
Statistical analysis
All pollutant measures were averaged over 24 hours. Daily averages were computed from the complete data set of actual and imputed pollutant data. These daily averages were included in the regression models, assessing lung function (peak flow and FEV1) measures obtained from the AirWatch monitors. We assumed a linear relationship between exposure and outcome. The lung function data was collected at four sessions per day, and all four measures were used as the daily repeated measures of outcome.
To adjust for the repeated samples design, generalised estimating equations (GEE) were used to assess the pollution-lung function associations. This approach was driven by our interest in robust estimates of fixed effects of exposures. The model accounted for both clustering of repeated measures within children, and clustering of children within schools/geographic locations.
Simulation studies on the behaviour of the GEEs are asymptotic in the number of clusters (m) (in our case, children), with m=200 probably large enough for approximately symmetric data. In addition, these studies show that the total number of observations ≥20*m, for asymptotics of the mixed models, (multilevel models) work well and will test hypothesis with 80% power or more. In our case, we have m=423 clusters (or participating children) and a total number of observations of 74 260. Based on previous studies with similar designs, we assumed a mean FEV1 of 1.8 (L) for children living in low PM10 exposure areas from previous studies. Thus, based on previous studies of similar longitudinal characteristics, with sample sizes of 300 children, producing pollutant-related effect estimates in lung function from 0.02 to 0.33, our sample size of 423 children had adequate power to demonstrate the exposure–outcome relationships of interest.21–24
Single exposure, single-lag effects (1–5 days), as well as 5-day averages and unconstrained distributed lags (DLM) were modelled. Covariates used in regression models included child’s age, gender, race/ethnicity, school, previous history of respiratory disease, atopy status, primary caregiver’s education level and smoking history, annual household income and phase. The regression models are explained further in the online supplementary material. Despite the narrow age range of the selected sample mean age (10 years (SD=0.5)), the distribution of gender (58% girls, 42% boys) and overall low socioeconomic status of the chosen communities, inclusion of these variables were necessary for matters of sampling design issues. With respect to other measures such as rainfall, temperature and humidity, they are directly and indirectly (through MI procedures) considered in the exposure measures, thus including them in the outcome models created multicollinearity issues. In our sensitivity analysis, some of the models that included these variables did not converge.
Both single and multiple pollutant models were assessed. Owing to concerns over multicollinearity among pollutants, single pollutant models are presented here.
The general model we considered for this analysis can be written as:
FEV1=β0 + β1 Conc+β2 COV1+ …+ βn COVn-2
where Conc took the form of each individual lag from 1 to 5 or 5-day average.
The model was modified to test for effect modification of AHR (marked or probable (AHR+) vs possible or none (AHR−)), asthma severity (persistent vs not persistent (ie, either mild intermittent or no asthma)) and location of child’s school (north vs south), through the inclusion of an interaction term.
Analyses were performed using Statistical Analyses Software (SAS) V.8.1.
Results
The mean age of the participating children was 10.5 (SD=0.9). A little over half of participants were females, with the majority of children being of African origin. Using the NAEPP categorisation, 19.5% had persistent asthma and 38.7% were atopic (table 1).
Sample characteristics (n=423)
Of the total sample of 423 students in the sample, participation rates varied across the seven schools. The expected number of observations for the total sample was 101 520 (423×4 times per day×15 days of observation×four seasons), and of these, we achieved a 73.1% success rate (74 260 observations). Generally, the major reason for the loss to follow-up was absence of pupils from school during the assessments. Of the data we collected (74 260), the missing pattern was 10% or less across different covariates.
Pollutant concentrations showed strong contrasts between northern and southern communities (online supplementary material 1). SO2 concentrations in the south were over fourfold, significantly higher (p<0.001) than levels in the north (mean (south)=8.7 ppb vs mean (north)=1.9 ppb). NOx levels in the south were also significantly higher (p<0.001), reflecting traffic sources. Maximum 24 hours PM10 concentrations at the northern school sites approached or exceeded 150 µg/m3. Pollutant concentrations varied across the different data collection phases : NO2 and NO had the highest levels in the colder months (data collection phases 1 and 2) (approximately 20–25 ppb (NO2) and a peak of 140 ppb for NO)) and the lowest levels in phases 3 and 4 ((16–17 ppb (NO2) and NO below 20 ppb). PM10and SO2 showed similar trends across the data collection phases (figure 2). Mean levels over the study period did not exceed WHO benchmarks.25

Variation in IQR)1 for (A) particulate matter (PM10), (B) sulphur dioxide (SO2), (C) nitrogen oxide (NO) and (D) nitrogen dioxide (NO2) across the different days for each of the four phases2 of the study. 1IQR: PM10: 29.4 μg/m3; SO2: 7.0 ppb; NO2: 8.19 ppb; NO: 29.7 ppb. 2 Phase (phase 1—June; phase 2—August/September; phase 3—October/November and phase 4—February).
Increased levels of NO and NO2 were associated with statistically significant decrements in FEV1 for all examined lags (figure 3A, online supplementary table S2), ranging from 13 mL (95% CI −23 to −3 mL) to 18 mL (95% CI −28 to −7 mL)) decrease per interquartile increase in NO2 and 14–23 mL/min for NO, with p values ranging from <0.002 to 0.011 for NO2 and <0.001 for NO. Patterns across the four lag structures of the two pollutants in the pulmonary function outcomes are very similar, with the 5-day average lag showing greater point estimates of decrements, but wider CIs, than the single-day lags.

Change in FEV1 and its 95% CI associated with one IQR1 increase in ambient levels of nitrogen dioxide (NO2)2 and nitrogen oxide (NO)2 from (A) single pollutant covariate-adjusted linear regression3 models and (B) distributed lag covariate-adjusted linear regression3 among all participating children (n=423). 1IQR:NO2: 8.19 ppb; NO: 29.7 ppb. 2Pollution levels used in regression models combine measured and imputed values. 3Covariates in each model: age, height, gender, race, school, caregiver smokes, caregiver’s education, household income, phase, ashma severity, interactions between asthma severity and exposure. *5 day average: average of lag1–lag5.
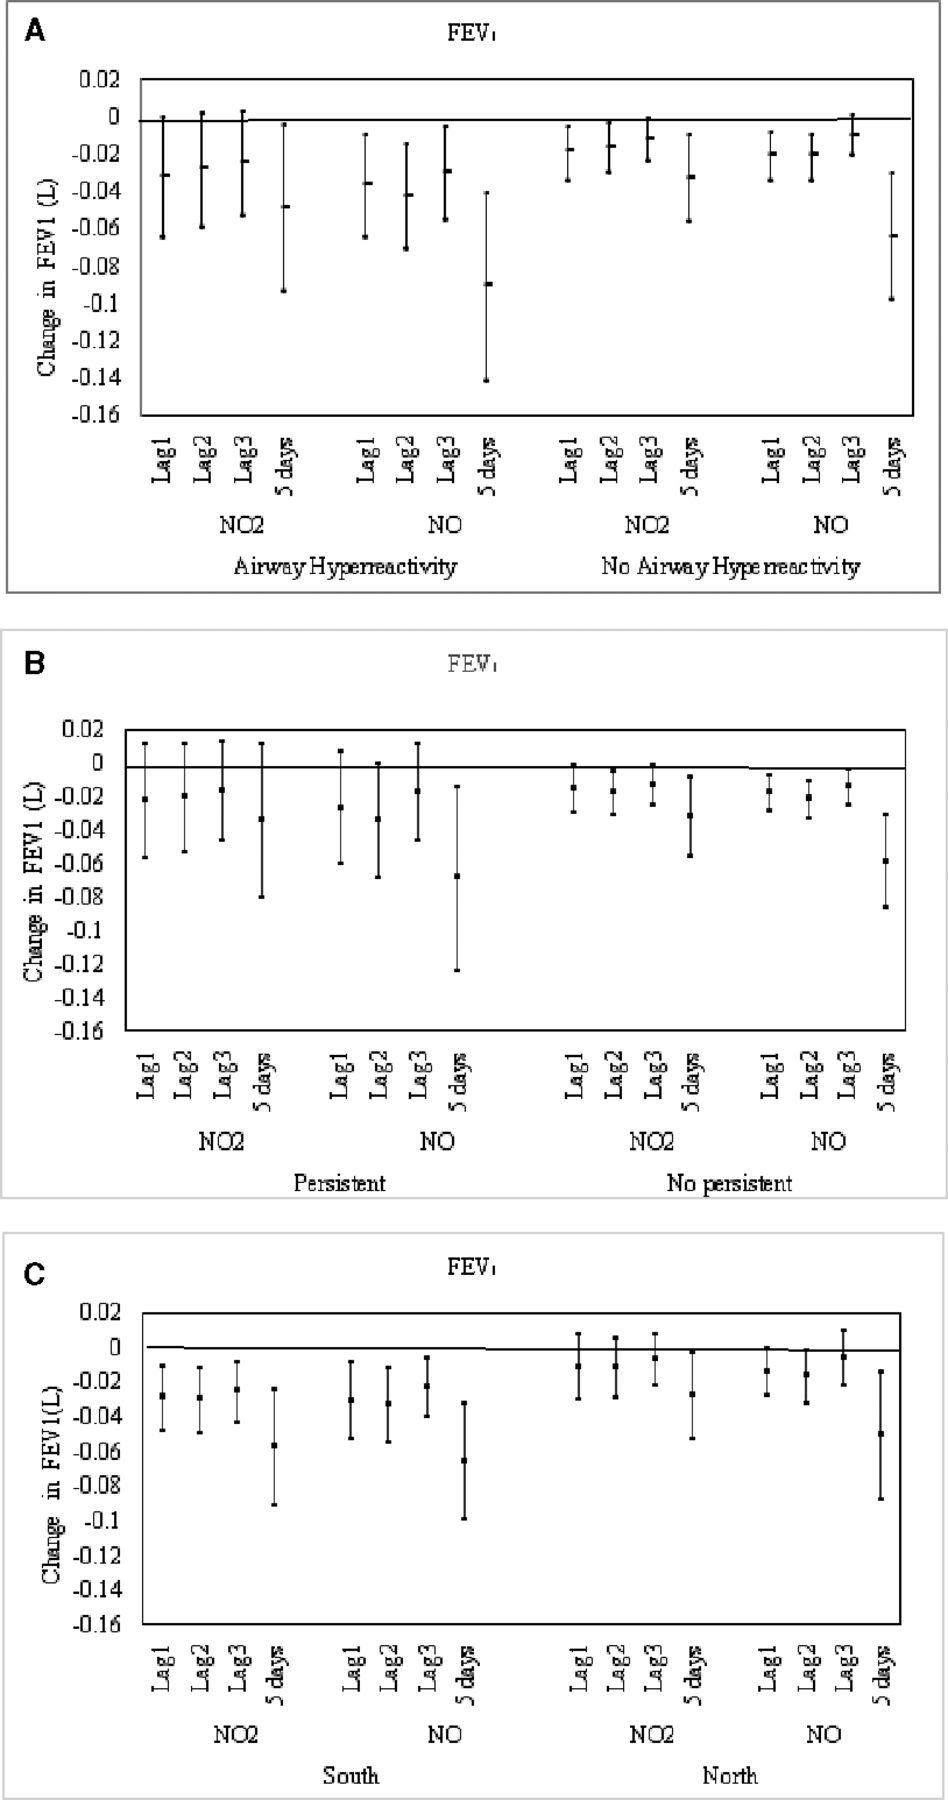
When assessing for effect modification by AHR, the patterns of the estimates for AHR+ and AHR− are similar for both NO and NO2. Among those with AHR+, greater point estimates of decrements with wider CIs, were seen, compared with AHR− (figure 4A, online supplementary material 1). These wider CIs reflect the small sample size of schoolchildren with AHR+ (n=50). For those with AHR−, pollutant-related decrements were consistent across most lags, with estimates ranging from 19 mL (95% CI −34 to -5; p<0.01) to 12 mL (95% CI −24 to -1; p=0.04). Among the 5-day average models, there was a 50 mL drop in FEV1 per increase in IQR of NO2 among those with AHR+ compared with to 30 mL among those without, and 90 mL versus 60 mL drop per IQR increase for NO among those with and without, respectively. This pattern was replicated for the other lags.
Change in FEV1 and its 95% CI associated with one IQR1 increase ambient levels of nitrogen dioxide (NO2)2 and nitrogen oxide (NO)2 from single pollutant linear regression3 models for (A) those with and without airway hyperresponsiveness; (B) those with and without persistent asthma and (C) those in the South and the North. 1IQR:NO2: 8.19 ppb; NO: 29.7 ppb. 2Pollution levels used in regression models combine measured and imputed values. 3Covariates in each model: age, height, gender, race, school, caregiver smokes, caregiver’s education, household income, phase, ashma severity, interactions between asthma severity and exposure. *5 day average: average of lag1–lag5.
Generally, greater point estimates of decrements of lung function was associated with NO and NO2 among persistent asthmatics, compared with those without persistent asthma (figure 4B, online supplementary table S2). The north and south locations were also examined as effect modifiers. For both NO2 and NO, point estimates for each of the four lagged models were lower in the south than in the north (figure 4C, online supplementary table S2). All eight models were statistically significant in the south (p values ranging from 0.002 to 0.004 for NO2 and 0.003 to 0.012 for NO), compared with four in the north.
Results for associations between other air pollutants (PM10, SO2, CO and O3) and lung function showed either no or few statistically significant relationships (online supplementary figures S1–S3).
The results from the DLM (figure 3B) were similar to the single exposure-single lag in terms of direction of effect, with a smaller exposure effect and less consistency of statistical significance. In the DLM, estimates for NO2 and NO, ranged from 1 to 13 mL and 7 to 26 mL declines in FEV1, respectively, compared with the larger estimates from single-lag model reported above.
Discussion
Our findings showed a consistent pattern of acute lung function decrements with increasing exposure with NOx in this panel of schoolchildren. There was evidence to support a modification of this effect among those with AHR, persistent asthma and geographical location. Effects were present among those children without persistent asthma or AHR and varied across lags.
Our sample and design allowed for the investigation of several pollutants, varied exposure lags and both FEV1 and PEF outcomes. Despite the substantial power of our study (over 100 000 data points of interest), we were not able to show consistent associations with pollutants other than NOx. This consistency and size of effect among all the participants in the panel is in keeping with findings from other studies.
Across several studies, NO2-related effects on cross-sectional assessments of FEV1 varied from −3 mL through to −49 mL per 10 µg/m3 increase in NO2, with a pooled estimate of −8 mL per 10 µg/m3 increase in pollutant.26 The latter meta-analysis reported a drop of 14 mL among non-asthmatic children. While cross-sectional lung function measures may be a sensitive indicator among asthmatic children, this approach may be less so among non-asthmatics. The use of short-term measures, such as daily measures of lung function, compared against average pollutant exposure within the same timeframe may provide better insight into the pollutant–outcome relationship. Repeated measures within a panel study has several strengths. Apart from providing the opportunity to observe simultaneous time-series patterns in exposure and lung function measures, the short-term measures permit analysis of lagged effects of pollutant exposure, which is not possible in cross-sectional studies. With each participant serving as their own control, confounding of non-time varying factors are not influential in the assessment of the relationship between exposure and outcome. Notwithstanding this, we included non-time varying factors in the model, to potentially address study design issues.
In our panel, among those with persistent asthma, the reduction in FEV1 was almost 40 mL per IQR increase of NO2 and a statistically significant 70 mL per IQR increase for NO over the 5-day average exposure. Panel studies of asthmatic schoolchildren have reported changes in per cent predicted FEV1 ranging from 0.24 through to 1.41 over a 24-hours lag.27 28 In a meta-analysis of panel studies investigating the association between NO2 and PEF, the pooled estimate showed no decline in lung function,5 although statistically significant declines were reported in other studies.29–31 In a child panel study in Salamanca, Brazil, in which spirometric assessments were conducted in each of four seasons, no declines were observed for NOx but were seen for other pollutants.32
We previously reported a prevalence of 16.2% of marked or probable AHR and a further 10.6% with possible AHR in this sample.14 Reports of panel studies employing AHR as a measure are limited—we identified a single study which described greater ozone-related PEF declines in a panel of children among those with AHR compared with those without.33 Our findings showed a clear modification of the pollutant-related effect among those children with marked or probable AHR. Although the absolute difference in FEV1 across the AHR strata was small (ranging from about 20–30 mL), this finding provides objective evidence that children with airways dysfunction are at greater risk for short-term pollutant exposure. A more surprising finding was that those children with possible or no AHR also showed a statistically significant pollutant-related effect across most lags. Our data clearly suggests that it is not only children with pre-existing disease that are affected by ambient pollution. However, whether these small decrements are likely the result of repeated airways insult during childhood and could translate into permanent airway damage in later life, provide interesting research questions for this population.
The modification by geographical location within the city was interesting, with pollutant-related effects being consistently greater in the south compared with the north, after adjusting for demographics and asthma severity. Our findings suggest that geographical location serves as a proxy for other unmeasured covariates. Similarly, our models including atopic status provided no clarity on this finding. One possible suggestion, based on our previous studies of this panel, may be a gene–pollutant interaction. We had previously reported that children in this sample, with the GSTP1 AG+GG genotype showed an increased risk for adverse outcomes with certain pollutants.34 The frequency of the GSTP1 AA genotype varied across geographical location (39.1% in the south and 31.9% in the north). Although geographical differences have been described in other panel studies, these did not adjust for pollutant exposure at these locations.35 36 Our adjustment for likely covariates strongly suggests that other unmeasured factors, including possibly chemical variation of particulates, may explain these findings.
The pollutant-related mechanisms in inducing the lung function response is not well understood, and despite evidence for an acute outcome, there are inconsistencies in reported studies about the lag effect. We investigated several lags and a 5-day exposure average. For NOx, there were consistent effects in the expected direction across all lags and the 5-day average exposure. This consistency was absent for the other pollutants. Previous studies have reported 1-dayto 2-day lags among asthmatics,28 while others have observed no lag effects for NOx.7 9 Other studies have reported effects for other pollutants such as ozone24 37 and particulate matter.24 28 These study-related inconsistencies in lagged effects are evident among both asthmatics and non-asthmatics and may therefore not be directly an airway-irritant effect. Reactive oxidative responses to NOxn in the airways have been postulated to as the mechanism of airway reaction.38 These may cause airway damage over a period of time, leading to a more acute response following exposure. The challenge in population-based studies, unlike in controlled laboratory studies, is adjusting for the cumulative effect or prior day/s exposures on the airways. These are likely to have an effect in priming the airways for subsequent pollutant exposure but are not easily adjusted for sample selection, study design or statistical analysis. However, our NOx-related responses in lung function, and its consistency with other studies provides further evidence that this pollutant is of particular concern within the broad suite of criteria pollutants, especially for acute outcomes.
The absence of a consistent pollutant-related effect with exposure to PM10, SO2 and O3 is contrary to the literature.24 28 39 This may be explained either by exposure misclassification or because of our sample being a mixed asthma/non-asthma panel. Although we endeavoured to ensure that pupils lived in close proximity to the school, this was not always the case. In such events, it is likely that the school-based monitor did not adequately describe exposure for that particular child. Most of the previous studies which have reported effects have been on panels which included asthmatic children only.
The exposure contrasts, mix of pollutants and the large size of the panel recruited for the study, allowed for the analyses of effect modifications and pollutant interactions necessary to examine susceptible populations. The exposure assessments used in this study was based on data from monitoring stations located at each of the schools and regionally from the monitoring sites of the city’s Air Quality Monitoring Network. Although there was missing data for certain time points, the availability of the extensive pollutant data set allowed us to develop models for data imputation. Although this imputation approach is likely to have added uncertainty to the exposure misclassification that may have occurred in our data, this was likely to have been at random. Our exposure measures were further compromised through the use of fixed monitors at schools, which did not account for at home exposures.
Although the levels of pollution in our study was below that of WHO guidelines,25 it was generally in the higher ranges of those reported in the literature from North American or European studies, with PM10 as much as twofold higher than that reported for Detroit (26 µg/m3)3 and NOx four fold higher as reported from Sweden (17.3 µg/m3).40 Our levels are comparable with studies from other developing countries such as Thailand and Korea.41 42
A limitation in our study was the conduct of repeated lung function measures ‘en masse’—all the children in the panel at all of the seven schools performed these assessments at more or less the same time, four times per schoolday, under the supervision of one field monitor in each class. Although pupils underwent training prior to each cycle, their correct technique cannot be guaranteed. Because of this, we used the technician performed spirometry data as the basis for determining the validity of bihourly measures. Those readings that were outside the 30%–120% range of the technician-derived FEV1 were rejected. Despite this, we still retained over 100 000 lung function data points, which provided us with sufficient power to explore the health–pollutant relationship.
Because individuals are simultaneously exposed to many air pollutants, there is a need to consider the multipollutant exposure phenomenon. The presence of multicollinearity prevents the use of standard statistical methods. In addition, the potential for interaction between pollutants, the common measurement errors, the number of pollutants to include in models and the potential nonlinear relationship between exposure and health, make the multipollutant analysis almost impossible to conduct without biased point estimates, with large and unstable SE estimates and variance inflation.43 44
Single-exposure distributed lag models have been used to characterise the lag structure of exposure effects. These models assume that the coefficients corresponding to exposures at different lags follow a given known functional relationship and that a finite and known number of lags are included in a particular model. The single pollutant DLM can be extended to multipollutant scenarios with the same ‘multicollinearity’ caveat.45 The single-exposure single-lag model was the most efficient approach, given the limitations of the DLM, and because of our interest in the effect modification analyses. Nevertheless, we also modelled our data using the single-exposure DLMs as a ‘validation’ technique of the point estimates from the single-exposure single-lag models. Results from these two models were compared and showed some degree of consistency of point estimates and CIs.
These results are not surprising given the statistical assumptions of both models. On one hand, the single exposure single-lag models assume that all the effect of the exposure is concentrated in that particular lag; on the other, the distributed-lag models assume that there is known functional relationship among lags and that all the exposure effects are concentrated in the first five 24 hours daily averages.
To address clustering within child and child within location, we chose to use the GEE modelling, with the patterned compound symmetry structure. GEE estimates of model parameters are valid even if the covariance is mis-specified (because they depend on the first moment, eg, mean). Our approach to this was to use the empirical estimates with robust estimates of the SE.
In conclusion, our panel study of 423 schoolchildren showed statistically significant decline in lung function measured across a schoolday, in response to exposure to NOx, with effects significantly modified by AHR, persistent asthma and location. This effect was particularly consistent for NO and NO2 and less so for the other pollutants. Our study provides evidence of short-term adverse responses in lung function following exposure to these pollutants at modestly high levels of exposure. Our findings indicate that current standards recommended by the WHO, particularly for NOx, are not protective of children with asthma. Further control of these exposures and improved regulation is necessary. The inconsistency in findings for the other pollutants suggest the need for further research. At a clinical management level, guardians of asthmatic children need to be aware of the increased risk of symptoms on high pollution days and subsequent days and days in which changing weather patterns may result in inversion layers.
Acknowledgments
The authors are grateful for support given by the Pollution Control Unit of the eThekwini Department of Health and the Durban University of Technology. We express our appreciation to Yogan Gounden, Thabang Molefi, Pamela Nasirumbi, Mary Lou Thompson, Siva Chetty, and the staff and students of all the participating schools. We also thank the research fieldworkers and our research administrator Jenny Pillay.
References
Footnotes
Contributors RNN, SB and TR chiefly responsible for concept and design. RNN contributed to acquisition. GM chiefly responsible for analysis. Drafting the work was done primarily by GM and RNN, while SB and TR were involved in revising it critically for important intellectual content. All authors contributed to the interpretation of the data, final approval of the version published and agreed to be accountable for all aspects of the work in ensuring that questions related to the accuracy or integrity of any part of the work are appropriately investigated and resolved.
Funding This project was supported by grants from the eThekwini Municipality, the South African Medical Research Council, and the US National Institutes of Health/Fogarty International Center (grant D43 TW000812). The funders played no role in the study design, collection, analysis or interpretation of the data, the writing of the reports or the decision to submit for publication.
Competing interests None declared.
Patient consent for publication Not required.
Ethics approval Ethical approval was obtained from the Institutional Review Board of the University of Michigan and the Biomedical Research Ethics Committee of the University of KwaZulu-Natal.
Provenance and peer review Not commissioned; externally peer reviewed.
Data availability statement No data are available.